Frappe PMM
PMO Matrix and Dashboard

On this page
Last updated on 24th March, 2026
PMO Matrix and Dashboard
PMO & Delivery Excellence
The following metrics track project delivery health, whether projects are running on schedule and within the estimated budget
Metric
Frequency
KPI Formula
Target
Metric
Off Track Project
Frequency
Weekly
Formula
Count of projects where actual progress < expected progress or past expected end date
Target
0 off-track projects at any given time
Metric
Project Cost Overshoot
Frequency
Monthly
Formula
(Actual Cost – Estimated Cost) ÷ Estimated Cost × 100
Target
≤ 10% overshoot per project
PMO Dashboards:
1. Project Progress
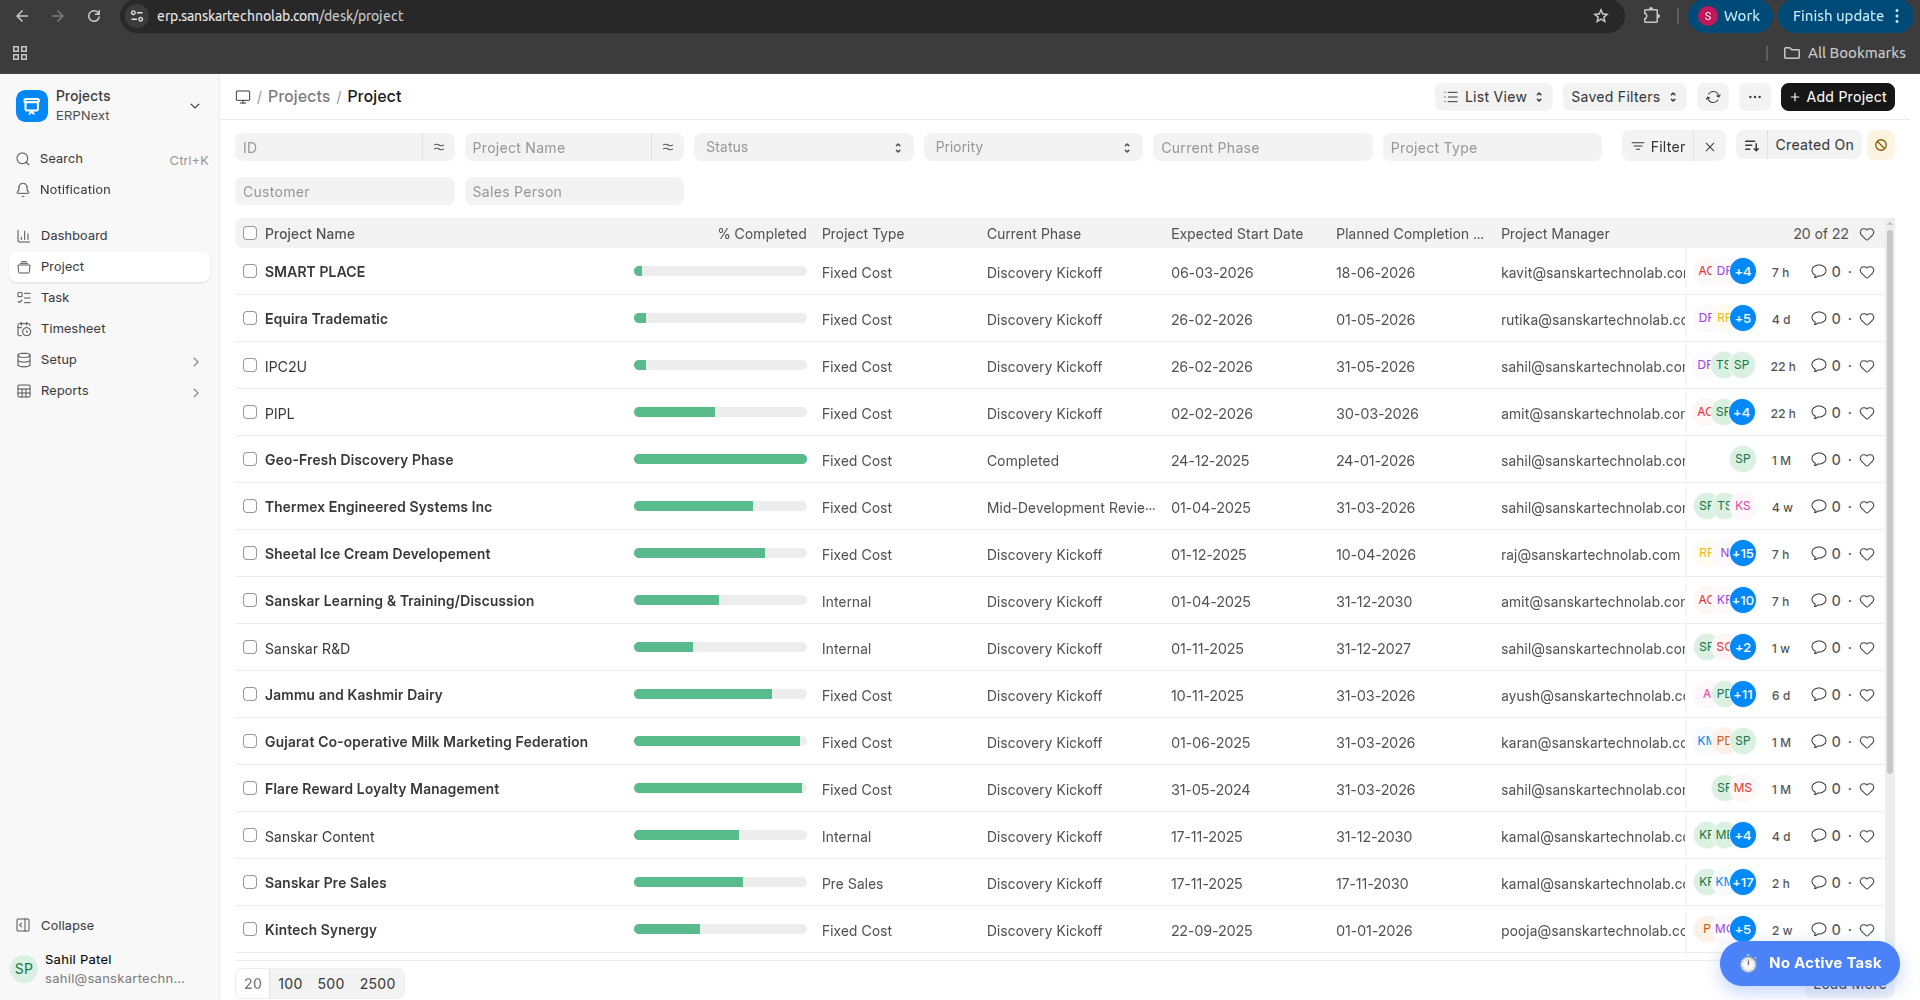
- All project tasks and milestones are tracked in the Project Management System (PMS) to monitor progress and maintain transparency.
- The Implementation Project Manager regularly reviews project status and shares progress updates with the client through scheduled meetings.
2. Task Progress
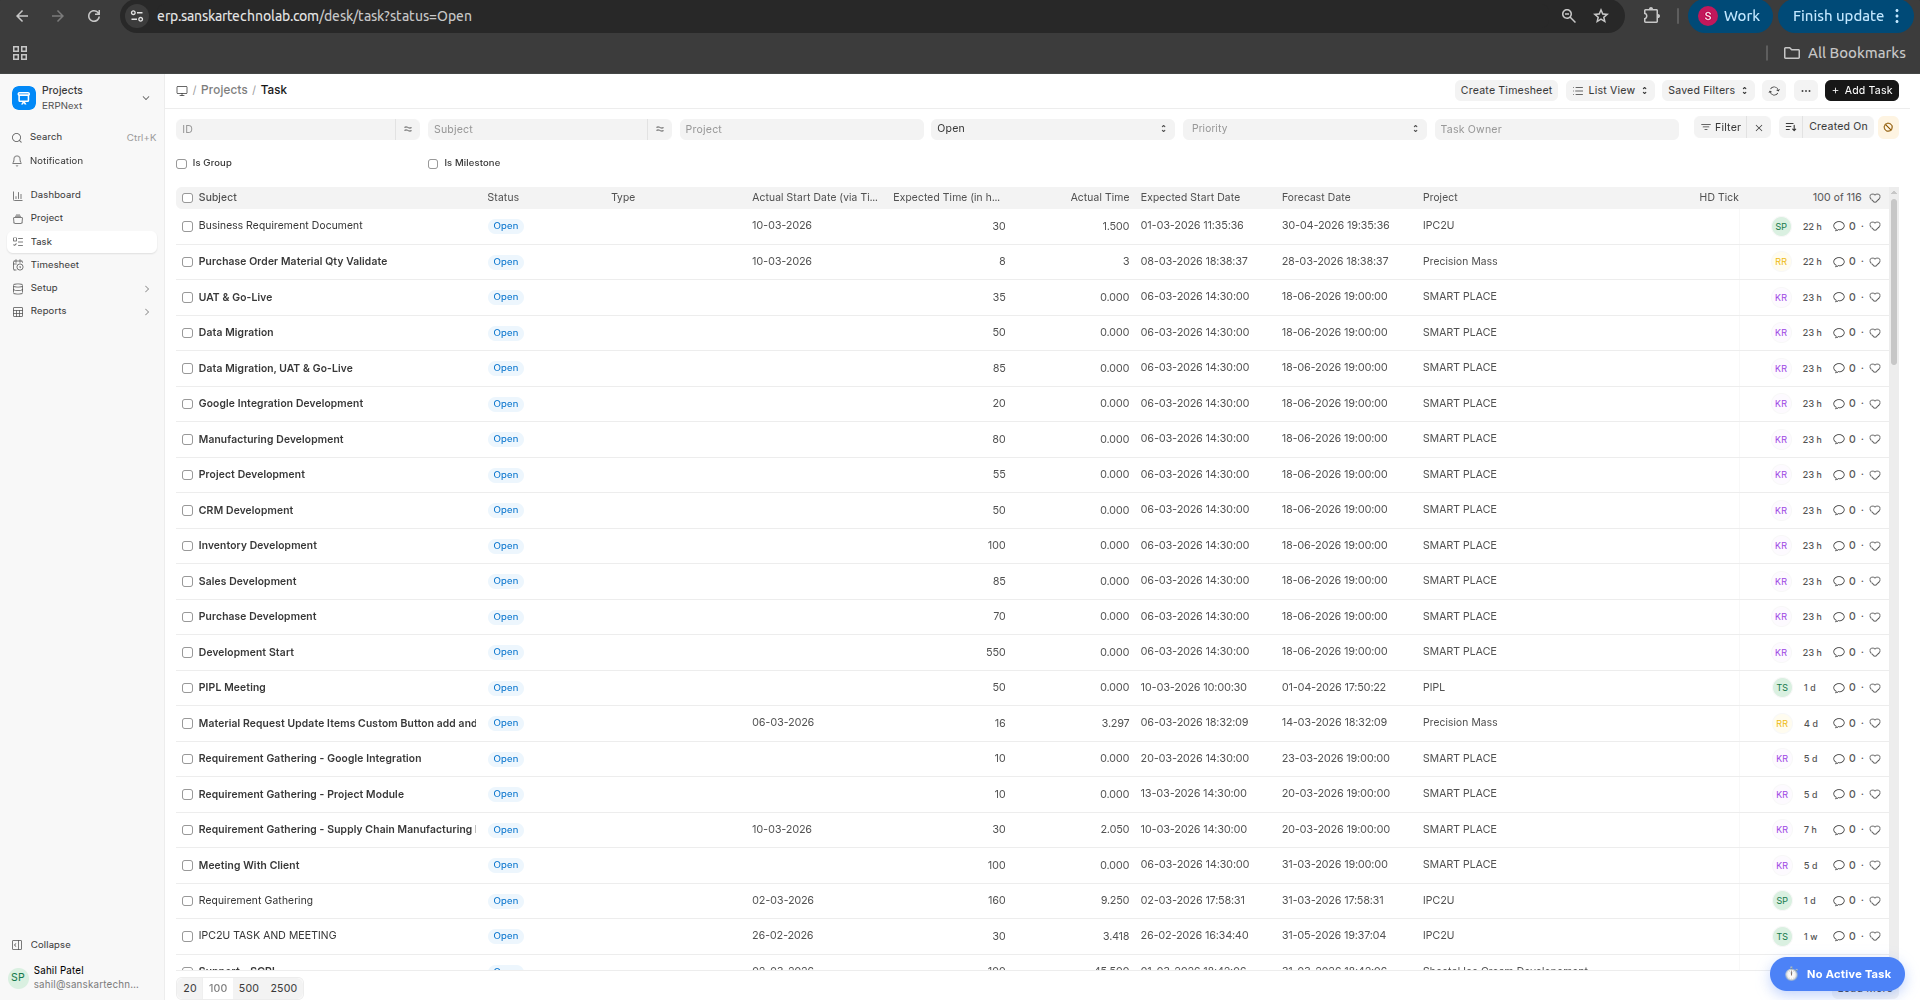
- All implementation tasks are created, assigned, and tracked in the Task Management system to ensure structured execution and accountability.
- Task status, timelines, and completion progress are continuously monitored to maintain the project schedule and delivery targets.
3. Timesheet Progress
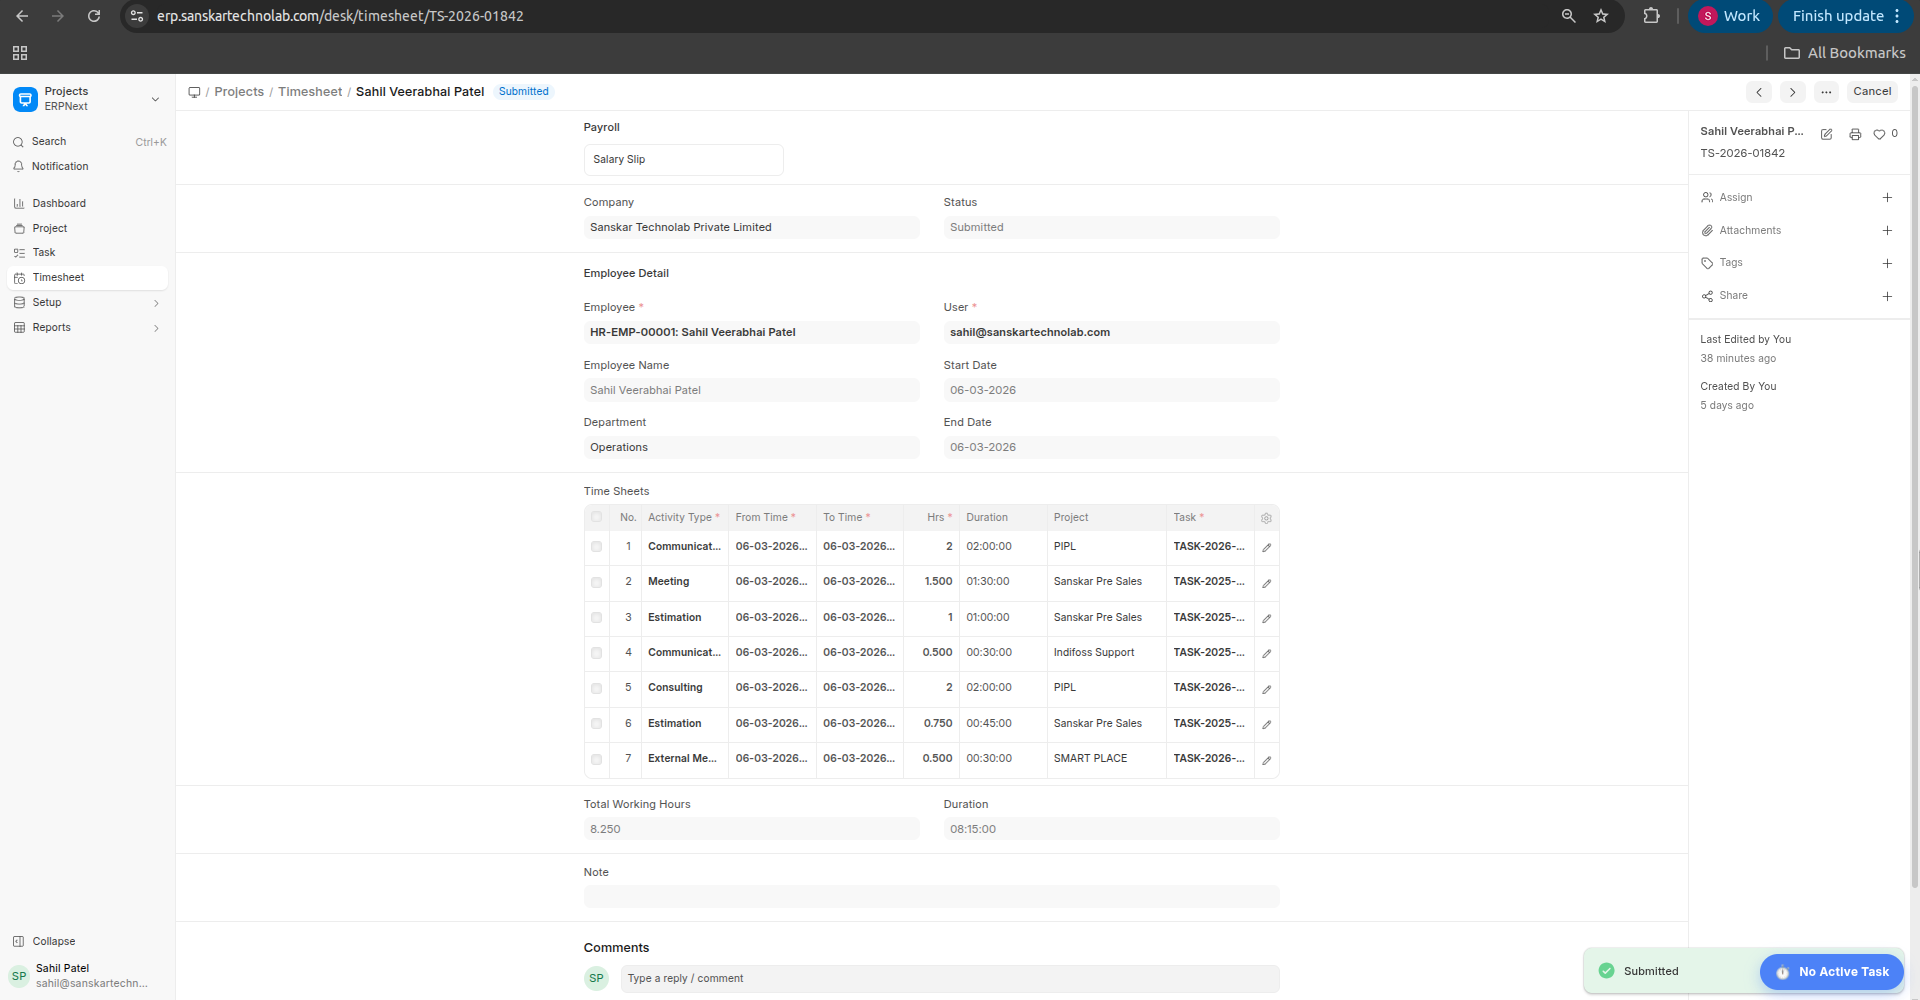
- All team members record their daily work activities and time spent on tasks through the Timesheet system to maintain transparency and accountability.
- This helps track actual effort against planned tasks, ensuring accurate project monitoring and resource utilisation.
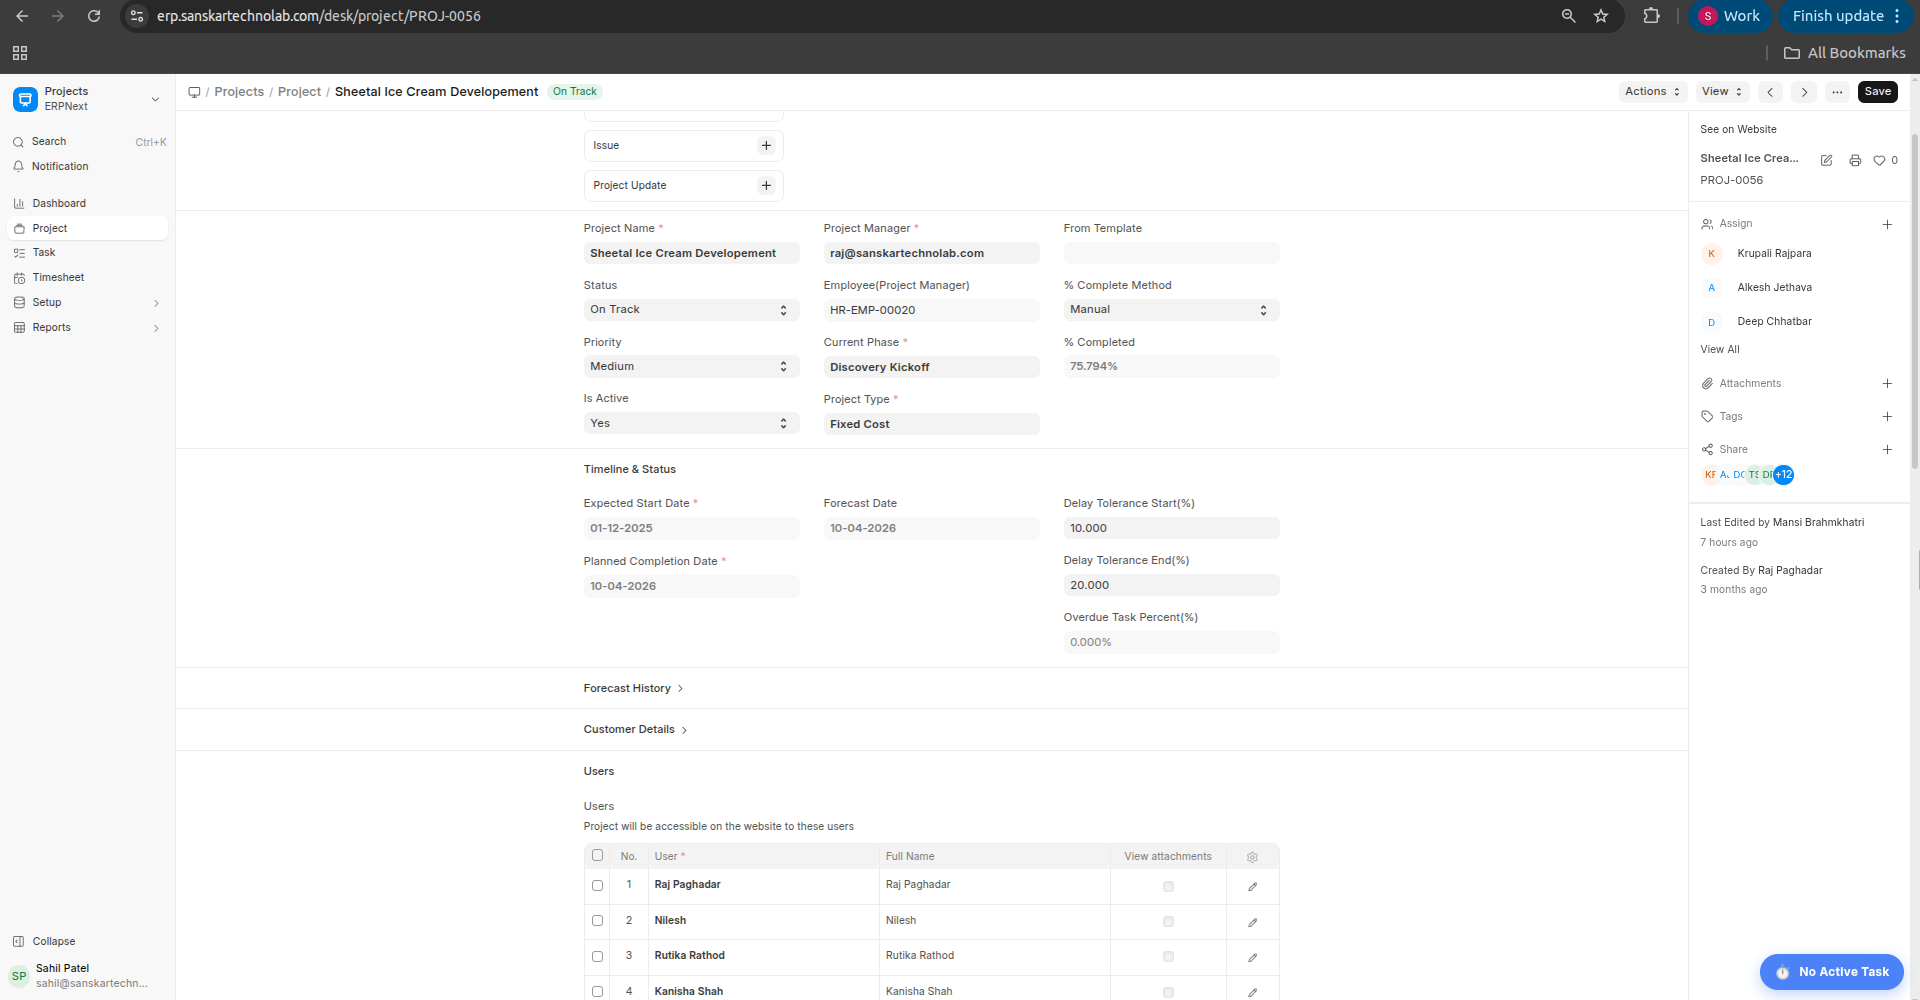
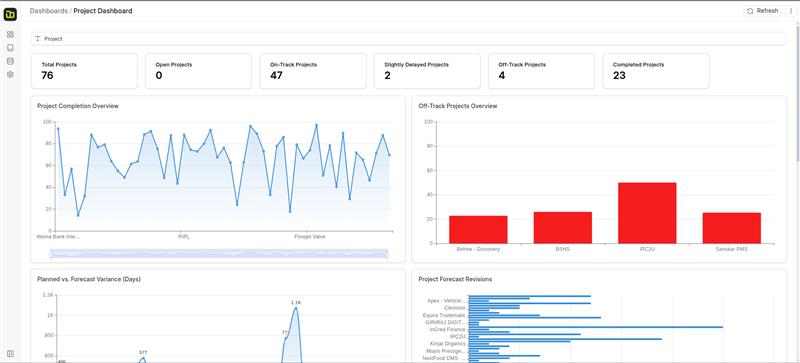
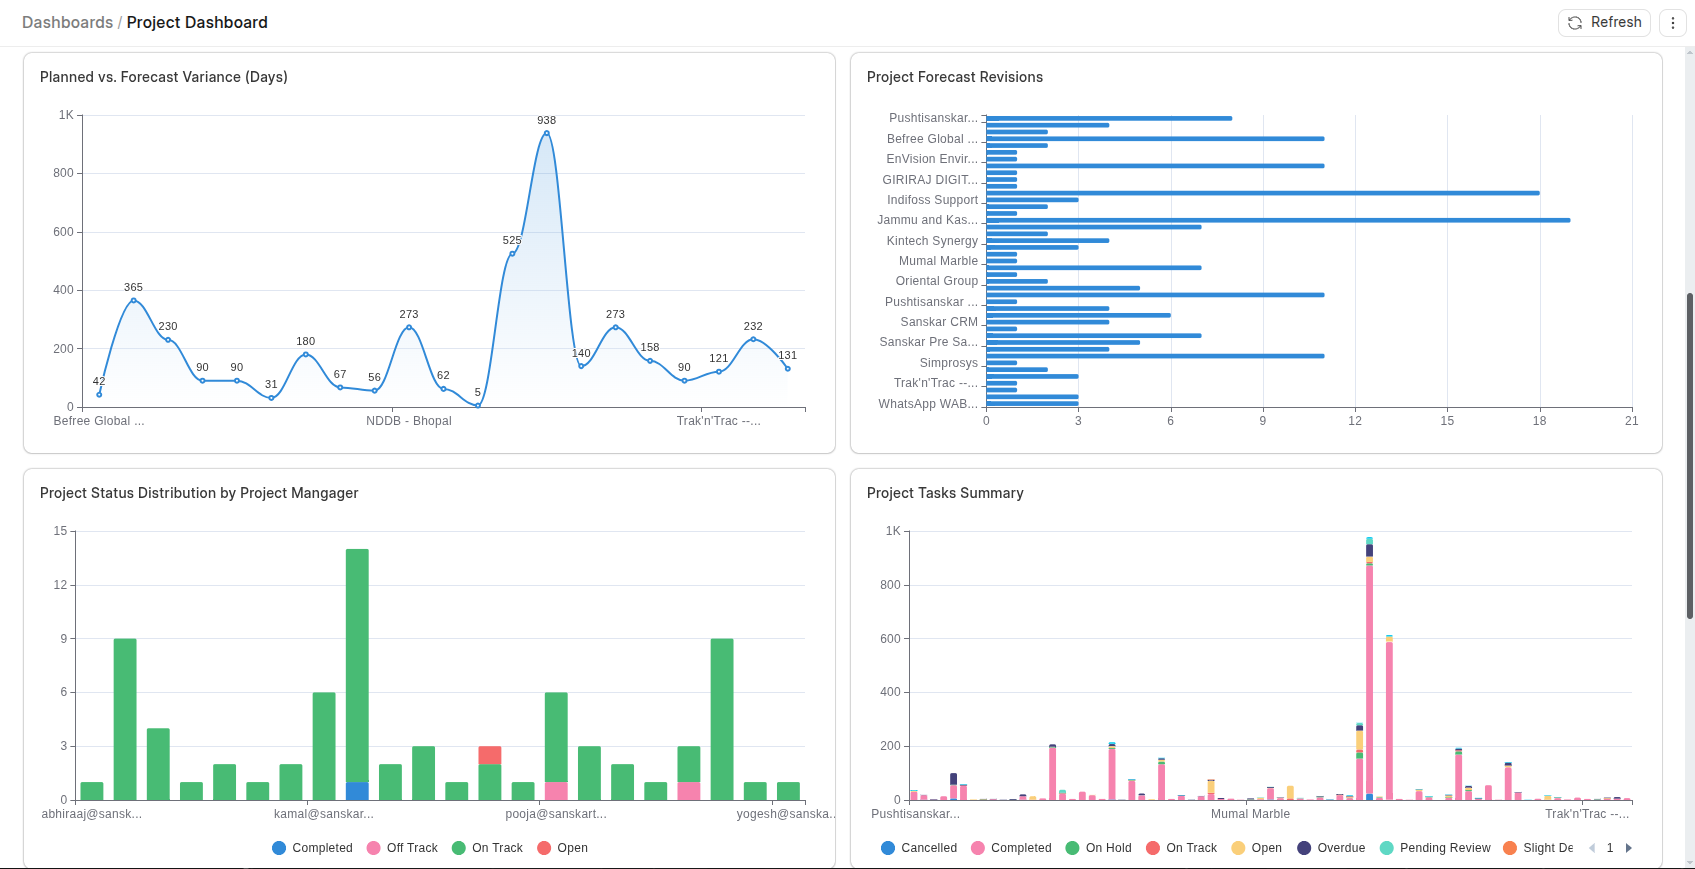
4. Project Dashboard
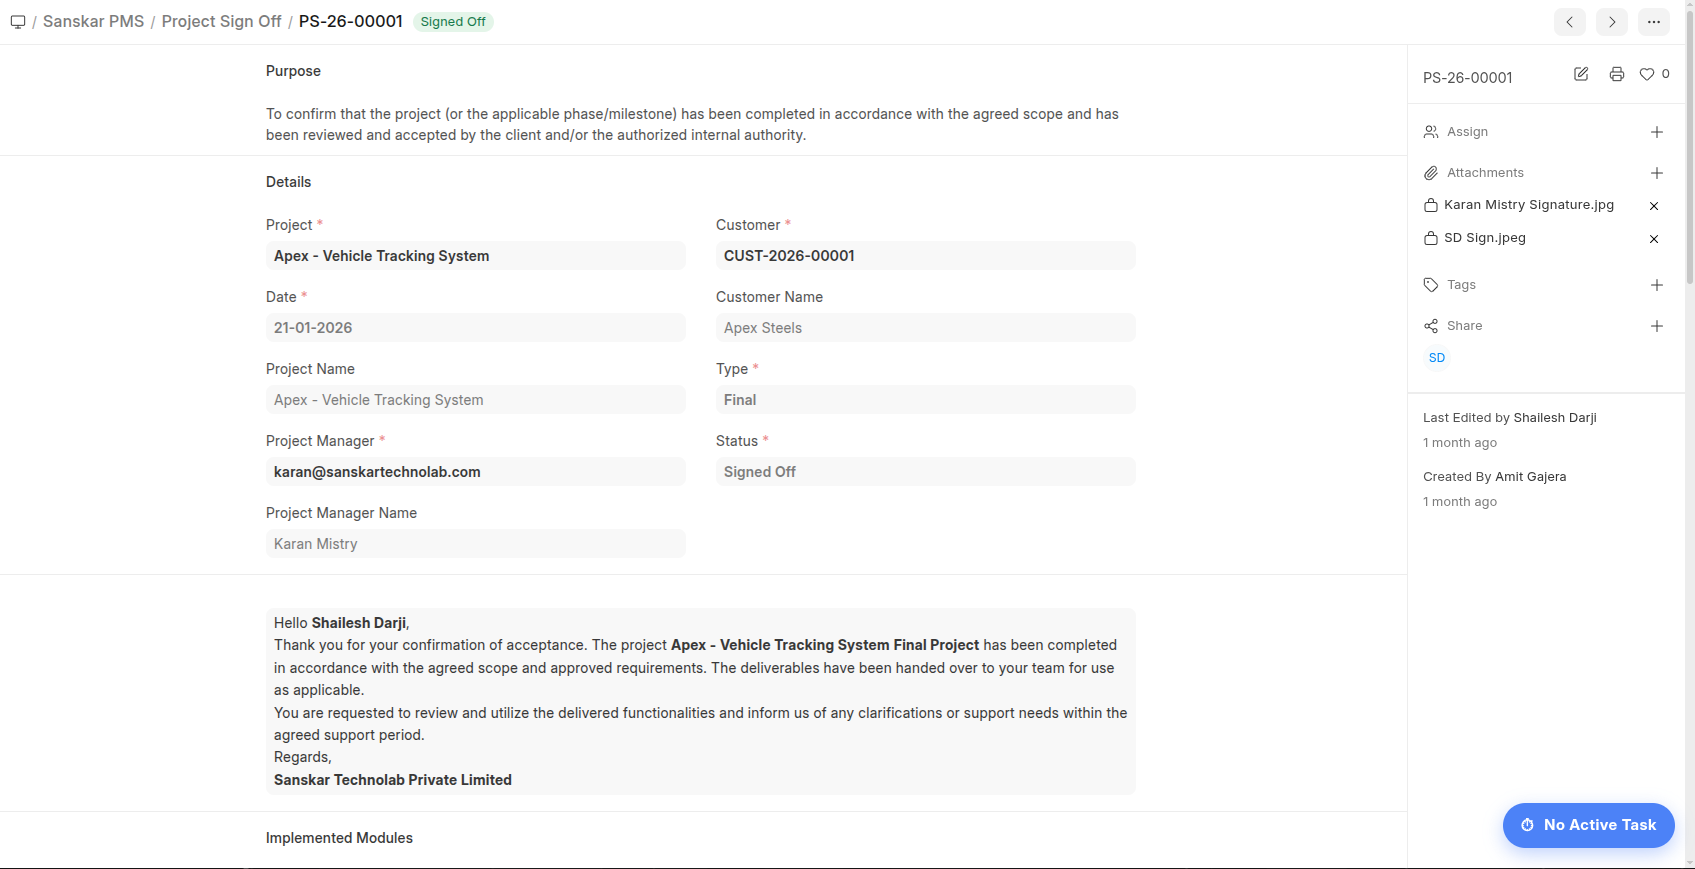
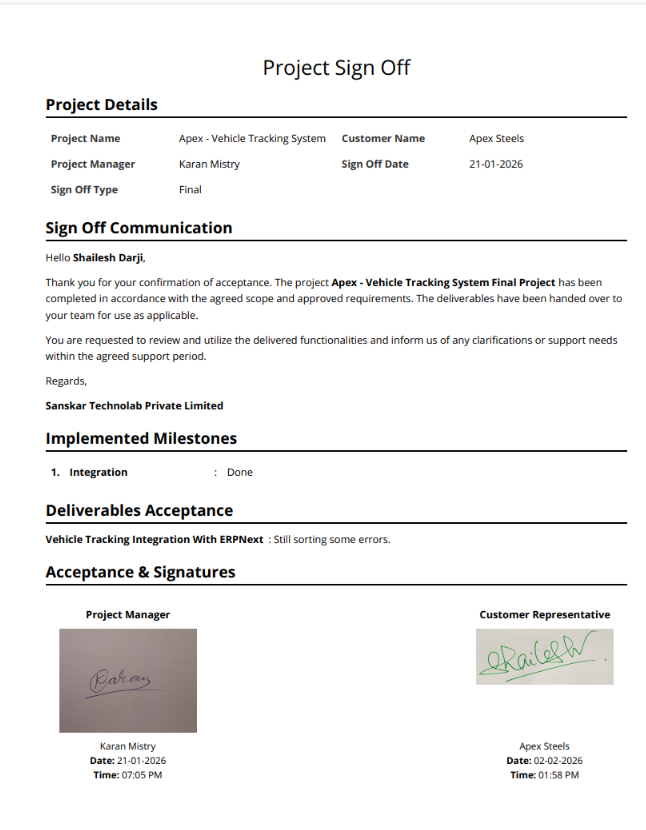
5. Sign Off